ZARA
Strategic Analysis 2026  ·  Project #03

By Chance,
On Purpose

How Zara's data infrastructure redefines speed, capital efficiency, and what a fashion store can become.

36%
ROCE
2,150
Stores Worldwide
15.3%
Net Margin '24
Jihye Yoon  ·  Data-Driven Brand Strategy
Scroll ↓
01 — Prologue

Speed is the only asset that matters.

"Where does Zara's unmatched efficiency come from — and what comes next?"

Zara pioneered fast fashion by turning every store into a logistics hub. But today's market faces two opposing forces: the race to the bottom on price, and rising sustainability pressure.

Having achieved record sales and maximum store efficiency, the question shifts: not how much to grow, but what kind of growth. This analysis uses Power BI visualization to diagnose Zara's growth velocity and capital efficiency, then proposes a strategy to maximize Zara's core edge: Speed & Digital Integration.

19%
Store Count
Reduction 2020–24
2.4×
Sales per Store
2020–24 Growth
36%
Zara ROCE vs.
15–20% Industry Avg
02 — Data Analysis
Power BI Dashboard — Full Overview ZARA Analysis Dashboard  ·  Jihye Yoon
Chart breakdown below
Analyst's Note

All indicators in this section are based on Inditex Group's 5-year public disclosures. Rather than fragmented external data, source documents were directly extracted via Python and refined through Excel into an independent dataset, then visualized in Power BI to uncover causal relationships between indicators.

Four charts. One story: qualitative growth.

01
Retail Optimization
Number of Stores vs. Sales per Store
Finding
Store count fell 19% over five years (2,653 → 2,150), yet average revenue per store more than doubled: 5.4M to 13.1M EUR.
Insight
A deliberate "focus and concentrate" play. Underperforming stores were cleared and replaced with digitally integrated flagship showrooms featuring smart fitting rooms, app-based inventory, and auto-checkout. Fewer stores, far greater impact.
−19%
Store Count
2.4×
Revenue per Store Growth
02
Annual Sales Growth & Profitability
Revenue Trend + Net Margin Evolution
Finding
Net profit margin nearly tripled: 5.4% in 2020 to 15.3% in 2024, growing alongside rising revenue, not despite it.
Insight
Premium line expansion and inventory optimization shifted operations to a high-margin structure. The MIT inventory algorithm forecasts demand in real time across all stores, minimizing waste and defending margin through disruption.
5.4%
Net Margin 2020
15.3%
Net Margin 2024
03
Operational Excellence
ROCE by Brand — FY2024
Finding
Zara's ROCE of 36% exceeds the industry average of 15–20% by more than double.
Insight
The number matters at massive scale. Capital isn't trapped in inventory. It rotates rapidly back into cash, proving that Zara's efficiency doesn't erode at volume.
36%
Zara ROCE
15–20%
Industry Average
04
Brand Growth (2020–2024)
Motion Scatter — Revenue & Net Margin
Finding
Zara's bubble moves consistently to the upper-right quadrant (High Revenue, High Margin) 2020–2024, while competing brands remain static.
Insight
Zara is the group's undisputed growth engine. The enabler is SINT (Single Inventory System), which unifies online and in-store stock and fulfills from the nearest location worldwide, eliminating lost sales and protecting profit.
SINT
Unified Inventory OS
Top-Right
Quadrant Position
03 — Strategic Dilemmas

Three tensions beneath the numbers

The four charts confirm textbook performance across store efficiency, revenue, profitability, and capital returns. But these same results expose three structural tensions Zara must resolve to sustain its trajectory.

DILEMMA 01

The ESG Paradox

Fewer stores, higher revenue per location: omnichannel efficiency perfects "selling more with less." But the same structure widens the gap between commercial output and the environmental cost of production, logistics, and disposal.

Freedom of Choice  vs.  Environmental Burden
DILEMMA 02

The Zara-Flavored High-End

Rising margin signals that premium lines and inventory efficiency are lifting profitability. But rapidly borrowing designer aesthetics demands that Zara prove its own originality and maintain a credible standard of creative ethics.

Profitability  vs.  Creative Integrity
DILEMMA 03

Premium Without Purpose

Movement into high-revenue, high-margin territory signals Zara's shift beyond fast fashion. But whether this profit structure connects to a credible ESG narrative on environmental and labor grounds remains unresolved.

High Margin  vs.  Earned Legitimacy
Strategic Proposition
The answer isn't discounting. It's turning surplus inventory into a designed experience where data selects the stage, and fashion does the rest.
04 — Strategic Solution

Zara
Live Show

Project #01  ·  Live Retail Experience

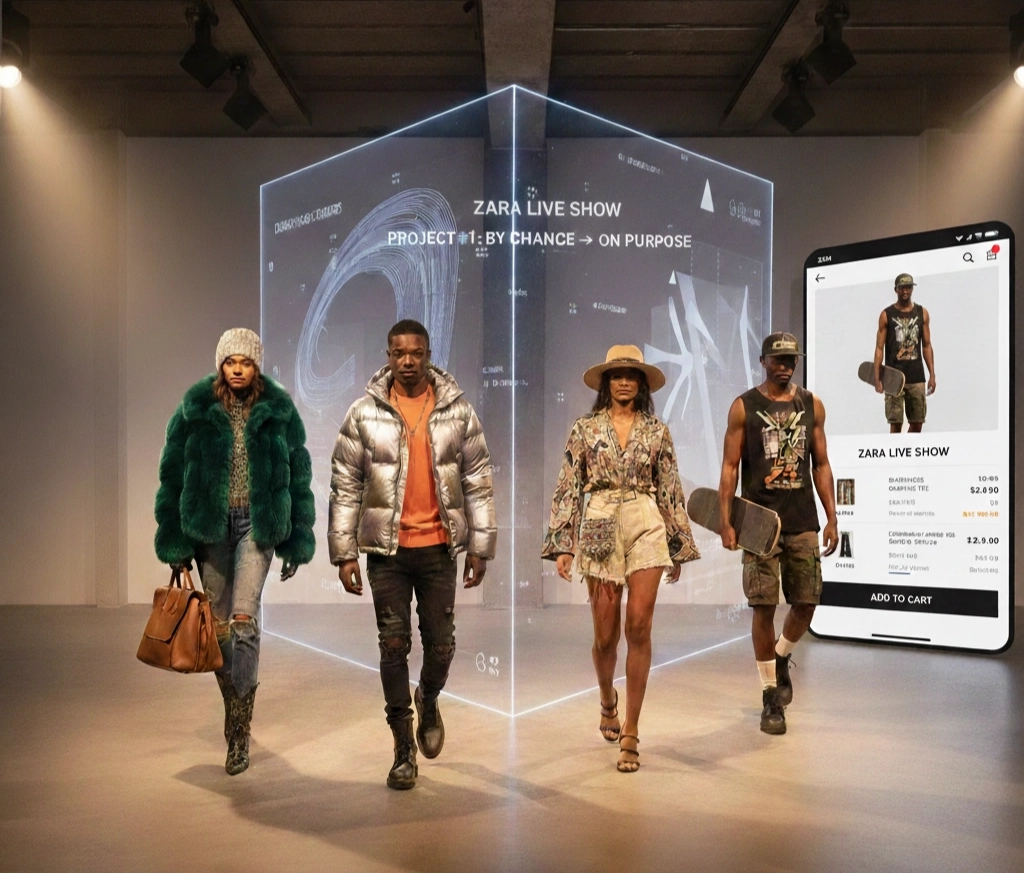
By Chance → On Purpose: A Data-Curated Fashion Show Using Excess Inventory

Core Concept: Rather than marking down unsold items as a clearance pile, the MIT distributed optimization model identifies excess inventory in real time and restages it as a live fashion show, performed by emerging models and sold instantly via SINT through the Zara app.
Project Visualization Zara Live Show  ·  Jihye Yoon
Zara Live Show - By Chance → On Purpose
01
Strategic Data Usage

Data-Driven Live Curation

Real-Time Inventory Intelligence

  • Items with excess stock, especially difficult designs or hard-to-style pieces, are selected in real time using the MIT distributed optimization model.
  • Live model styling converts latent demand for high-inventory items into active purchase intent. Strategic exposure, not clearance.
02
Brand Identity

The Small Live Show

Zara's Signature Refinement

  • Not influencer casualness. Emerging models deliver professional walks and editorial poses, maintaining Zara's designer-adjacent sensibility.
  • Broadcast simultaneously in-store and on the Zara app, the show turns a transaction into a premium experience worth attending.
03
Omnichannel Integration

SINT-Powered Real-Time Orders

Live Purchase, Zero Friction

  • Viewers order items directly through the Zara app while watching. No delay, no cart abandonment.
  • The SINT system deducts sold units in real time across online and in-store inventory, preventing sales loss and defending margin throughout the live event.
04
Environmental Responsibility

ESG: Local Impact & Circularity

From Waste Risk to Brand Story

  • Zero inventory disposal: data gives value to clothes at risk of being discarded, creating a genuine circularity loop that directly addresses Zara's most persistent environmental criticism.
  • Emerging model ecosystem: providing new talent with paid exposure reduces marketing costs while contributing to the local fashion economy.
Implementation Framework
WHO
Zara consumers seeking experience beyond purchase and emerging models seeking professional exposure
WHY
Improve the sale-period store environment, resolve environmental risk from accumulated stock, and elevate customer experience
WHAT
MIT algorithm-selected excess inventory: hard-to-style items with high residual stock
WHERE
Small in-store showroom broadcast simultaneously on the Zara official app
WHEN
Designated dates during the sale period. Surprise scheduling creates anticipation
HOW
Live model show with SINT-linked app ordering. Extreme contrast between everyday value and premium live experience
Expected Impact
Financial
Reduced holding costs with margin strengthened through rapid clearance
Store
Sale zones cleared and premium environment restored
Omnichannel
Live sales raise app conversion and drive integrated online-offline growth
ESG
Reduced disposal volume addresses fashion's most persistent environmental risk
Experience
Shopping becomes a fashion show moment: a premium memory, not just a purchase
05 — Epilogue

By Chance
to On Purpose

Data confirms it: Zara has achieved an overwhelming edge in the world of numbers. High capital efficiency proves that invested assets convert to value faster than any competitor. The next evolution demands something numbers alone can't deliver: the recovery of environmental accountability and the quality of the lived store experience, long obscured by operational success.

"Turning discarded inventory into the star of a stage. Replacing the chaos of a sale with the memory of a refined show."

Zara Live Show deploys Zara's core engines, the MIT algorithm and SINT system, as an artistic showcase giving surplus inventory a second life. This isn't inventory management. It's a strategy that delivers data-optimized styling and the fashion show as premium experience, proving that the most efficient operator in fashion can also be its most compelling one.