Strategic Analysis 2026

Cold Data,
Warm Connection

A Data-Driven Strategy to Restore Starbucks' Essence

From efficiency-driven operations to emotionally-centered experiences

9.63% Operating Margin 2025
-7.14% Margin Decline
4 min Order Time
Scroll to Explore ↓

Why Starbucks, Why Now?

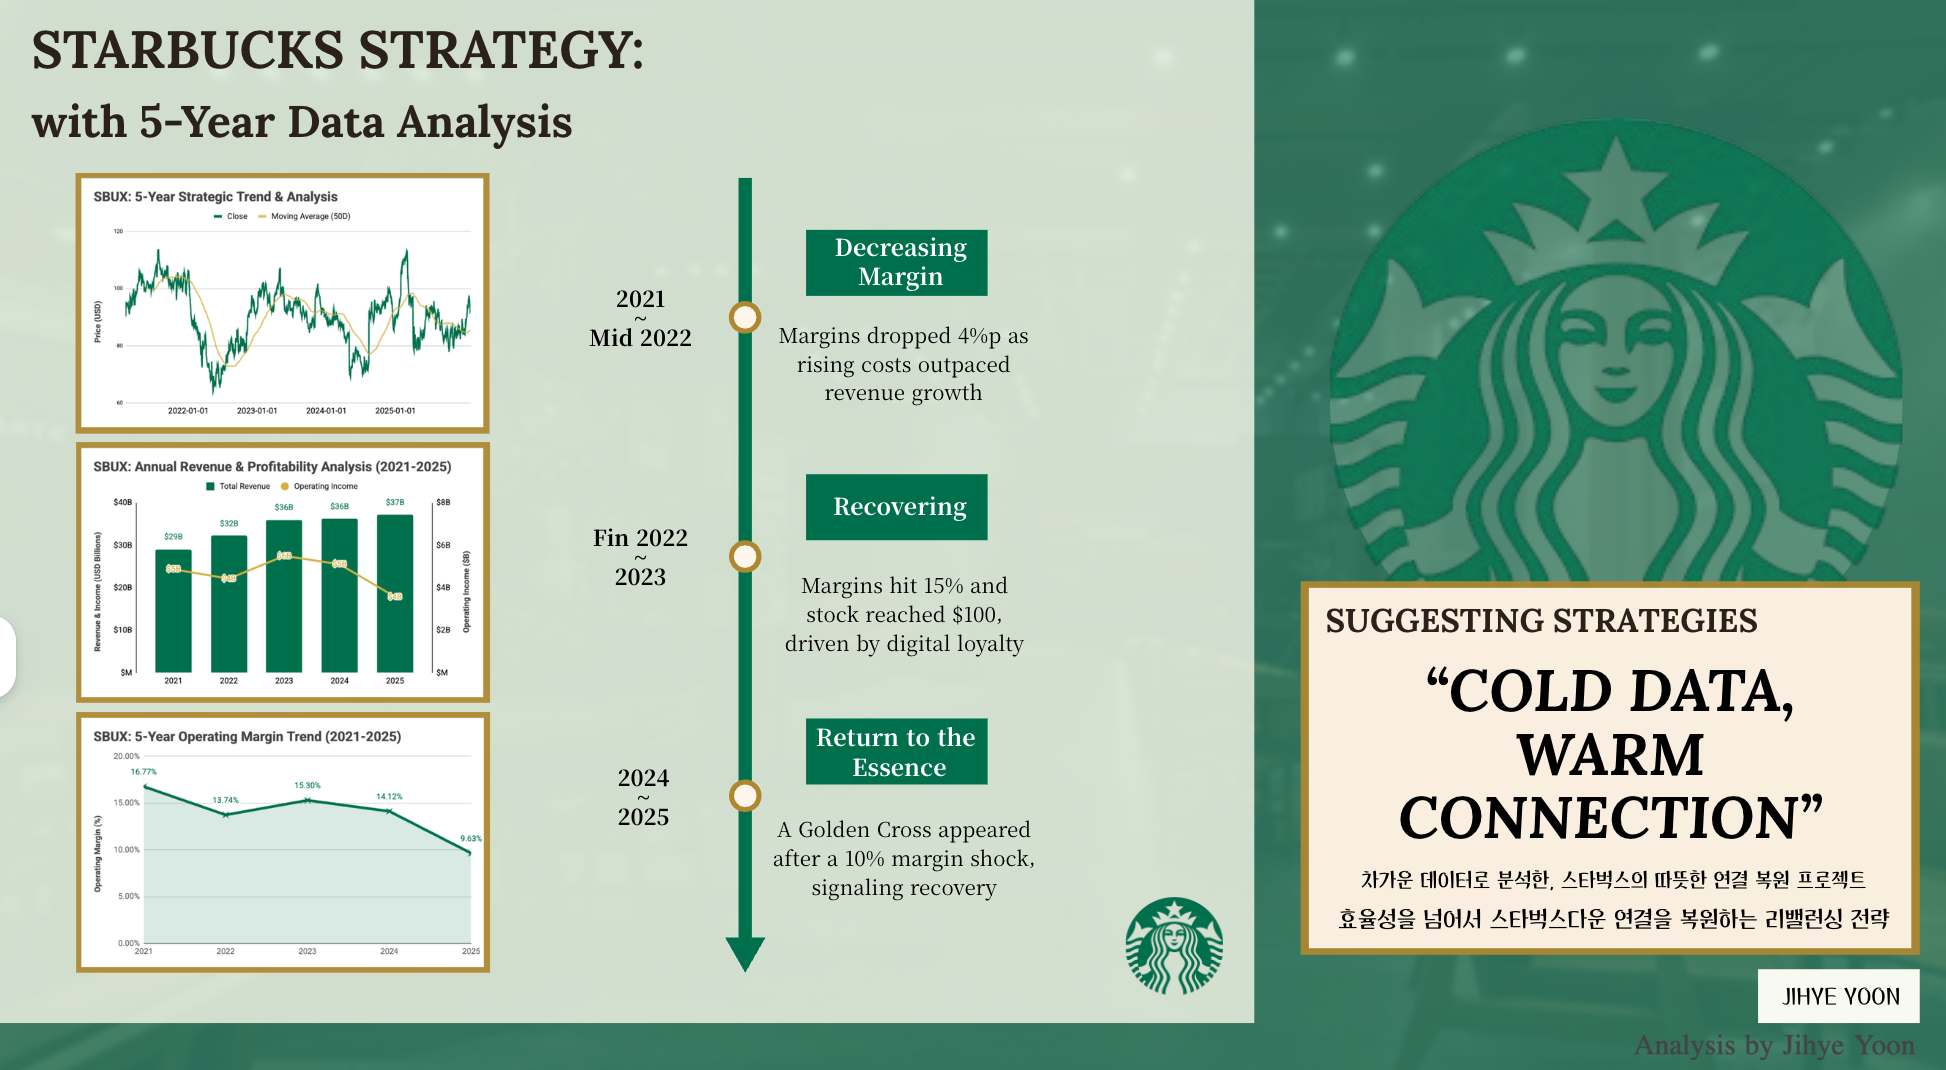
"In gaining speed, what did we lose?"

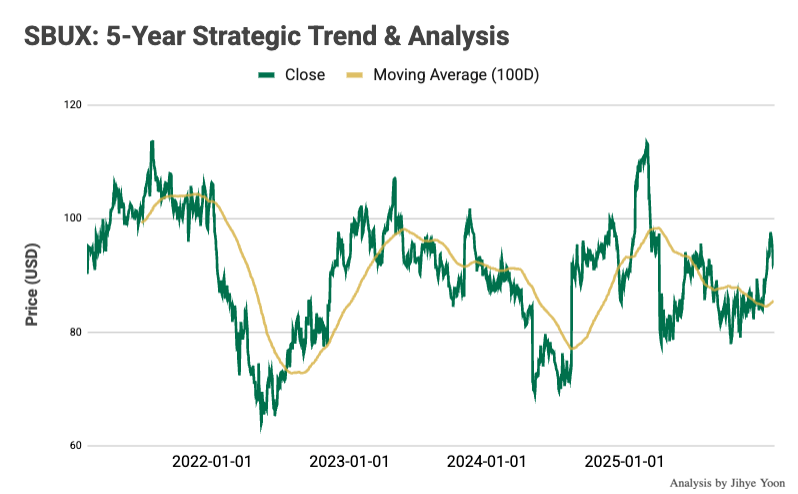
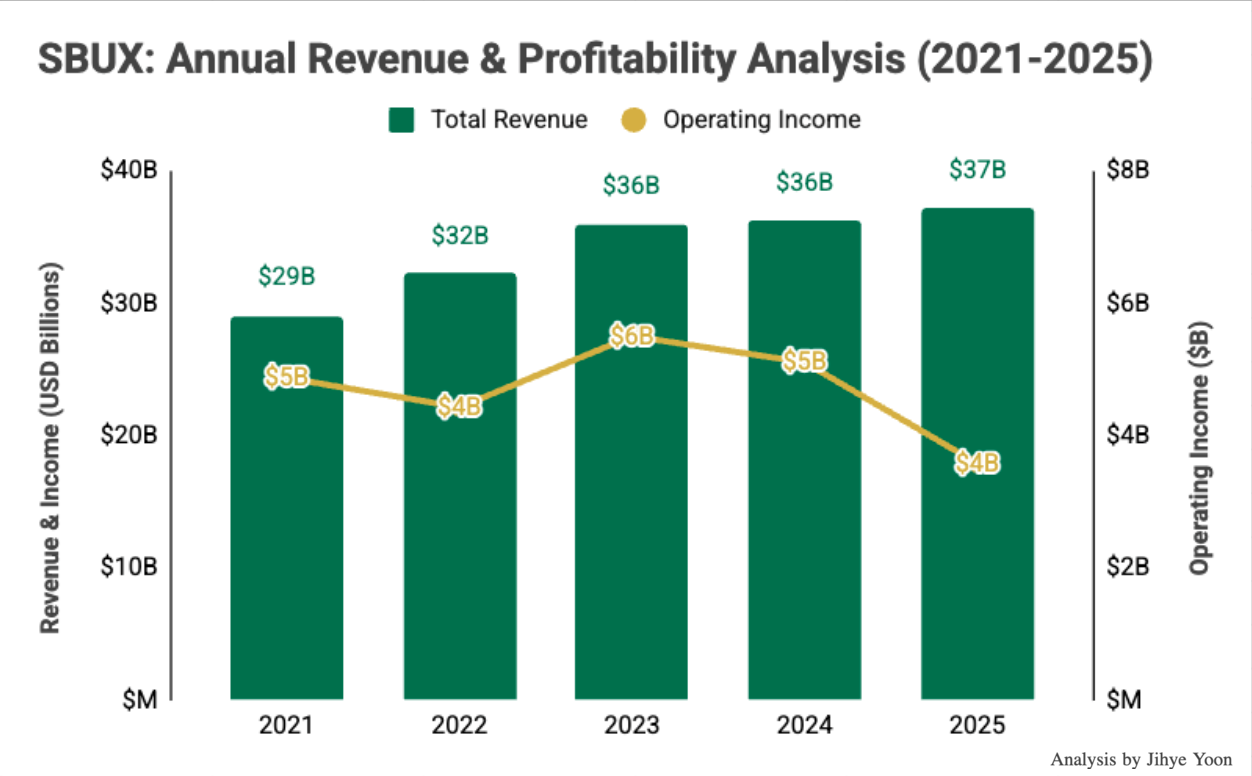
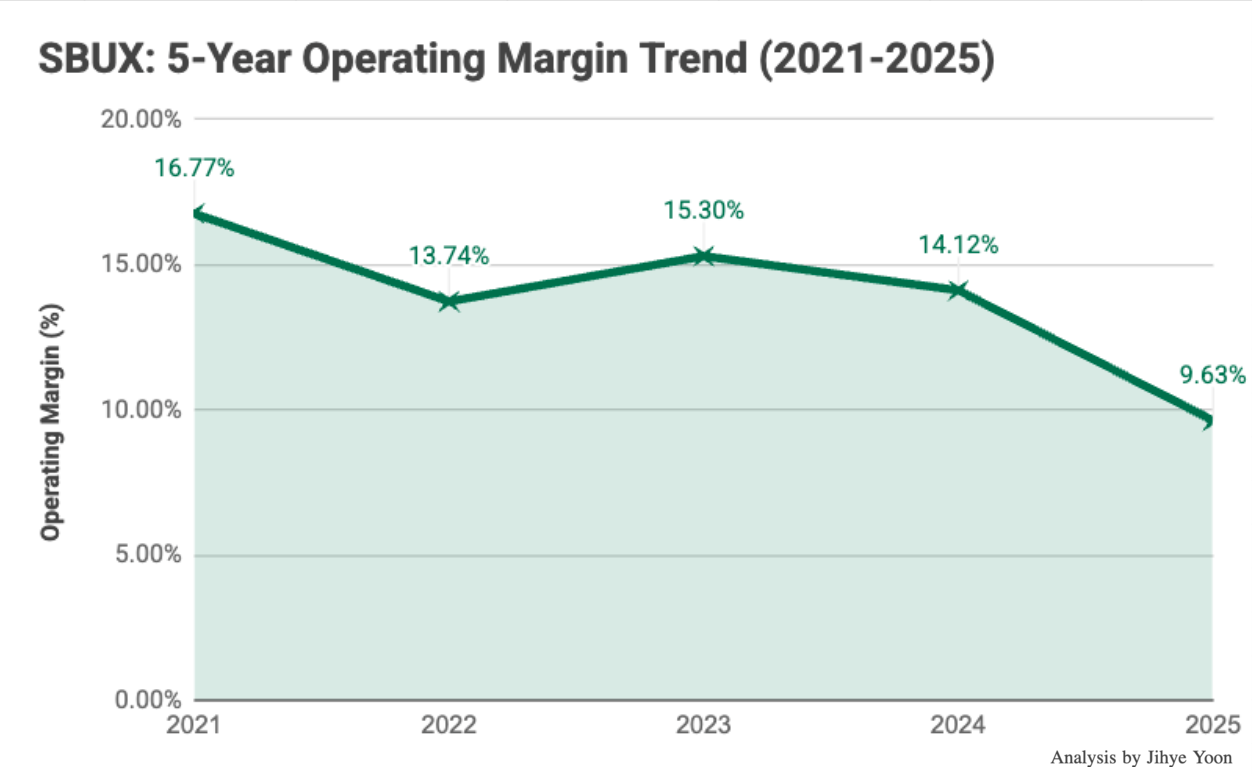
"More stores, faster orders." The efficiency and speed that Starbucks has pursued have become a double-edged sword. Despite record-breaking revenue, declining operating profit margins and stock price volatility force us to ask critical questions.

This analysis diagnoses Starbucks' crisis through Cold Data (quantitative analysis) using Python and Excel, and proposes strategies to restore the brand's essence: Warm Connection (emotional engagement).

Confronting Starbucks' Reality Through Data

Independent visualization analysis: Market indicators extracted via Python (yfinance) and reprocessed through Google Sheets

Analyst's Note: All data analysis below uses Python (yfinance) to directly extract market indicators, then reprocessed through Google Sheets for analysis-specific visualization. The focus is on uncovering meaningful correlations while maintaining Starbucks' identity.
SBUX 5-Year Operating Margin Trend
01

Efficiency Analysis: Operating Margin Collapse

Metric Calculation

Visualized 5-year operating margin trend to measure core business efficiency.

Operating Margin (%) = (Operating Income / Total Revenue) × 100
Diagnosis The margin dropped from 16.77% (2021) to 9.63% (2025), falling below the psychological threshold of 10%. This suggests that Starbucks' premium-based "pricing power" is under threat, beyond just rising costs.
16.77%2021 Margin
9.63%2025 Margin
-7.14ppPercentage Point Drop
SBUX Annual Revenue & Profitability Analysis
02

Profitability Structure Diagnosis

Data Processing

Direct comparison of annual Total Revenue and Operating Income trends to capture the "profitability shock" period and identify structural limitations in growth translation.

Key Insight Revenue increased steadily from $29B (2021) to $37B (2025), yet operating income dropped from $6B (2023) to $4B (2025). The widening gap between revenue bars and operating income lines proves that external growth no longer translates into actual profitability: a structural limitation.
+28%Revenue Growth
-33%Operating Income Drop
WideningRevenue-Profit Gap
SBUX 5-Year Strategic Trend & Analysis
03

Stock Price & Market Confidence Analysis

Analysis Method

Combined daily closing price data from Python with 100-day Moving Average to visualize long-term value trajectory and identify strategic trend patterns.

Key Insight The sharp decline in Q2 2024 represents more than a market correction; it signals a "crisis of confidence." However, the recent upward trend in the 100-day moving average, showing signs of a golden cross, reflects market expectations for the new management's "return to essence" strategy.
-35%Peak to Trough
+12%Recent Recovery
100d MAGolden Cross Signal

Three Critical Dilemmas

Cross-analysis of data and news/interviews reveals three decisive contradictions

Through cross-analysis of quantitative data and qualitative sources (news articles, executive interviews), Starbucks currently faces three fundamental paradoxes that threaten both its operational efficiency and brand essence.
⏱️
DILEMMA 01

The Speed Paradox

Order time reduced from 6 to 4 minutes has transformed partners into "manufacturing machines" and customers into "order numbers," eroding the human connection that defines the Starbucks experience.

🌅
DILEMMA 02

The Morning Trap

Over-reliance on morning "Caffeine Rush" creates afternoon Dead Time, intensifying store vacancy rates and rent burdens while leaving valuable capacity underutilized.

💔
DILEMMA 03

The Trust Fracture

Supply chain issues and labor disputes weaken the justification for the "premium" that consumers pay, undermining the brand's value proposition and customer loyalty.

5-Year Data Analysis: The Journey to Recovery

Starbucks Strategic Dashboard
This comprehensive dashboard synthesizes five years of quantitative data to illustrate Starbucks' strategic journey—from margin deterioration through recovery attempts to the current inflection point signaling return to essence.

Cold Data, Warm Connection

Monetizing afternoon dwell time to defend profitability and restore brand value

Project #1: Cold Data, Warm Connection

Compensating Morning Rush with Afternoon Value

Core Concept: Combine Beacon technology with gamification to transform store dwell time into "warm experiences" captured as data.

🏪

In-Store Experience

Beacon technology visualizes customer dwell time as "Digital Tree Growing." The tree's background displays the store's actual suppliers, partner education history, and videos, giving customers "joy of staying" while Starbucks gains "transparent trust."

🚗

Mobile & Drive-Thru

Drive-thru and mobile users receive digital tree growth accelerators based on consecutive visit data. Routine users during afternoon hours (2–5 PM) receive limited menu reservations and exclusive merchandise priority, distributing traffic to afternoons.

🌱

Local Connection

Afternoon purchases convert discounts into "community donations." Customers gain psychological satisfaction from "making a positive impact in our neighborhood," realizing the Neighborhood Value central to American culture.

Implementation Framework

Why

Restore collapsed brand trust and space value / Defend operating margin

What

Beacon-based gamification / Supply chain & partner visualization / Omnichannel routine design

Who

Customers seeking afternoon focus & rest / Efficiency-driven DT & mobile users / Morning customers

Where

Starbucks app and North American offline stores

When

Afternoon hours: 2 PM to 5 PM (The Second Peak)

How

Reallocate marketing budget from "discounts" to "local donations" and "experience design" to protect profitability

Expected Impact

📈
Financial
Maximize idle time revenue / Optimize marketing efficiency / Improve operating margin
🌍
Social
Data-driven community contribution secures ESG authenticity
Service
Partner professional branding / Enhanced service quality and loyalty
❤️
Connection
New bonds between stores, customers, and communities
Experience
Establish brand routine of "warm experiences shared through data"

1971 Heritage, Wearing Technology

"Reviving the value of abandoned time through data,
and restoring lost emotional bonds through technology."

The data signals a "restart" for Starbucks to return to its original spirit. While revenue has grown but substance has diminished, Starbucks is pursuing "futuristic evolution" that maintains its 1971 Seattle roots while embracing AI and modern lifestyle trends.

This project aims beyond simply increasing revenue figures. Its purpose is to implement what Starbucks stands for—"genuine connection with customers" and "restoration of trust"—through technology.

By diagnosing with Cold Data and completing with Warm Connection, this strategy will become the core driving force for Starbucks to re-emerge as the most forward-thinking brand without losing its essence.

Jihye Yoon